# remember, we need to ensure we've installed the packages we need, but we need to do this very infrequently ( to run the 'install' lines below, simply delete the '#' before the code:
# install.packages("devtools")
# install.packages("xlsx")
# install.packages("tidyverse")
# devtools::install_github("JaseZiv/worldfootballR", ref = "main")
# once it's been installed, then we need to load the functions (code to let you get the data you want) in the library (this needs to be done every time you want to run your script)
library(worldfootballR)
library(tidyverse)
library(xlsx)
Introduction
Do you find your love of football and curious mind converging to the point where you want to dig a little into the data to confirm if what your eyes are seeing is in fact what’s happening, but you just don’t know how to get started, or where to get data from? Or maybe you have already started doing some analysis in visualisation software, including PowerBI, Tableau, Excel, etc, or know enough about statistics to want to perform some statistical modelling, but you just need to know how to get access to more data, quicker and easier? Then this post will be for you.
This post will hopefully teach you how to use worldfootballR - an R package built to aid in the extraction of world football data from a number of popular websites (with their consent).
The post will demonstrate how to use the package to extract your data programmatically and save it in a suitable file format that your report ingests, saving you the manual steps of extracting data from popular websites listed below.
Additionally, I will also aim to demonstrate the visualisation tools available in R, if you so choose to invest the time into learning R.
A final aim of the post is to highlight what’s possible in R for those new to R programming in the hope that it stokes enough interest to get you started on your R learning journey.
What this post won’t be is an in depth how-to-code-in-R post - there are plenty of online resources, including MOOCs, posts, screencasts, etc to do that. This post will focus on getting you up and running with data in your hands… or on your screens.
What data can I get?
The package as at version 0.3.2 provides access to data from the following data sites:
- FBref.com (a whole host of data to analyse, including results, match stats, season long stats, player and team stats, etc);
- Transfermarkt.com (player market values, team transfer history, player transfer history); and,
- Understat.com (shot locations data for matches played in the major leagues)
These three sites are regularly used by analysts the world over, however the package is constantly evolving and may include data from additional sites in the future.
To my knowledge, only FBref provide the ability to export data to a file - the other two don’t, so you’d need to find some other way to get your data (painfully slow copy and paste), and that’s where worldfootballR come in.
Prerequisites
The only prerequisites to this post are that you have a computer, internet connection and the desire to analyse world football data. This post is designed to take any aspiring analyst with absolutely no R coding experience to being able to extract data programmatically using the worldfootballR R library.
What is R / Why would I use R?
From R’s official site (https://www.r-project.org/about.html);
R is a language and environment for statistical computing and graphics.
You can find out a lot more about R as you get more experienced with the language on the home page, but all you need to know for now is that R will be another tool in your toolkit to perform the analyses you want to do. R is an amazing programming framework that allows you to do a number of things, including data cleaning, performing statistical analysis and modeling and building fully customisable visualisations using the R programming language.
Importantly, anything programmed means it’s repeatable. Set up your code upfront, then simply rerun it to get consistent results.
The world is your oyster if you have the drive to learn.
Installing R and RStudio
This first section will detail the steps required to install R and RStudio, before you can get started with pulling data using worldfootballR.
Getting started
Ok so a few things before we dive right in… this is in layman’s terms (because I myself am a layman). R is the engine, the coding language driving everything you want to do, and RStudio is the pretty graphical user interface (GUI pronounced “gooey”) that gives you additional functionality when writing code in it. I am going to propose installing both R and RStudio in this post, but if you don’t want RStudio (I advise you to go with RStudio), you could still run the code to get the data you need (I will assume here everything is done in RStudio).
Install R
You remember how I said I’m a layman? It’ll extend itself here. We’re going to install R and we’re going to use all of the default options (just keep clicking “accept” or “agree”, or “continue”, and nothing else until R has been successfully installed. You can customise the installation when you’re better versed in R, but for now, just show me the data!
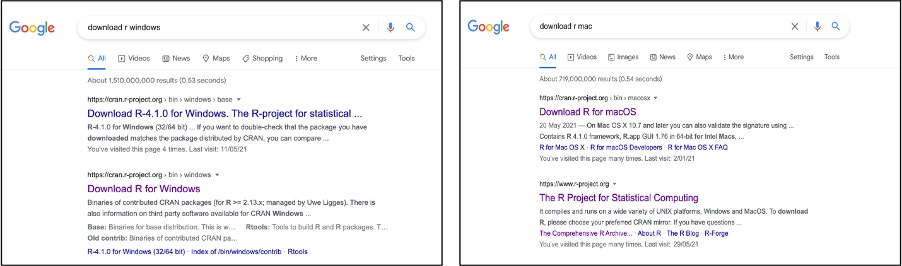
So how to find R to install R you ask? Well, you have to type into Google some really sophisticated stuff… “download r windows” or on Mac OS… yep, you guessed it, “download r mac”.
If you can’t be bothered doing that, here are the links:
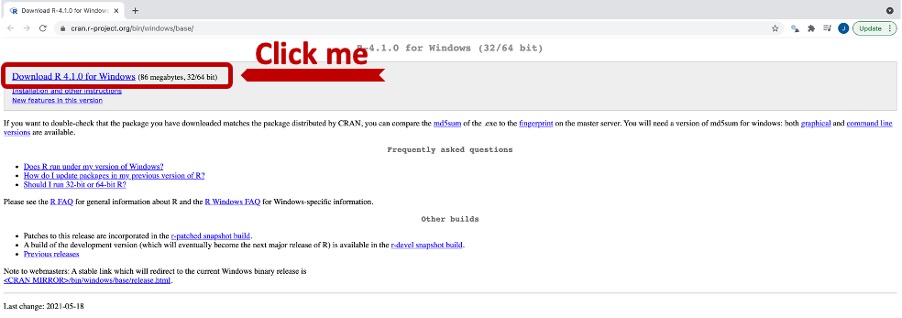
- For Windows OS: https://cran.r-project.org/bin/windows/base/
Select “Download R X.X.X for Windows”, with “X.X.X” being for whatever is the most recent version of R:
- For Mac OS: https://cran.r-project.org/bin/macosx/
Depending on what version of Mac OS you’re running will determine which version to install, but generally speaking it’ll only be one of the highlighted options below:
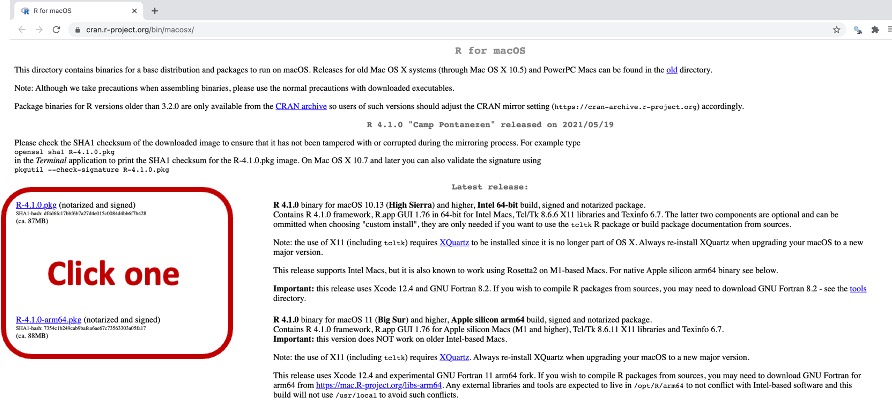
Once you have selected either of the Windows or Mac OS versions, install as you would any software, remembering my one special rule at the start of this section… default options all the way.
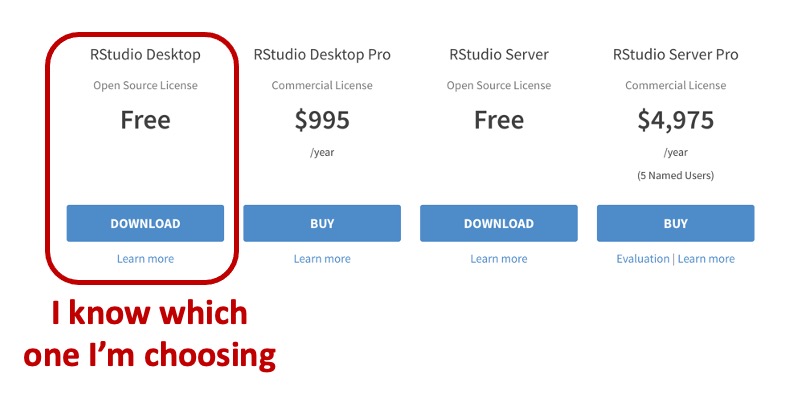
Now for RStudio
Once R has been installed, we can now go ahead and install RStudio, remember, the GUI that will allow you to code in and provide additional functionality.
Back to our intricate Google search query… “download rstudio”, and select the first result:
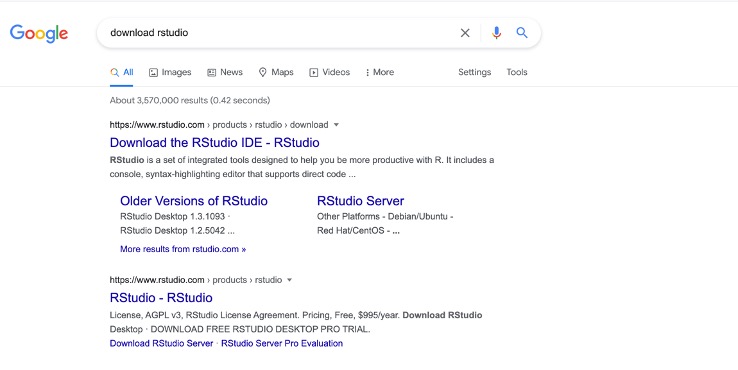
Or for the URL: https://www.rstudio.com/products/rstudio/download/
Once we’ve opened the page, we’re presented with a few pricing options, but if you’re like almost all amateur analysts (let’s be honest, even professional analysts), you’re probably only going to need the free version:
We’re (almost) ready to start coding!
Well, we’re almost ready to start coding, but first we’ll do a bit of a tour of RStudio (again, for those that have forgotten, RStudio is the software where we type and execute our R code).
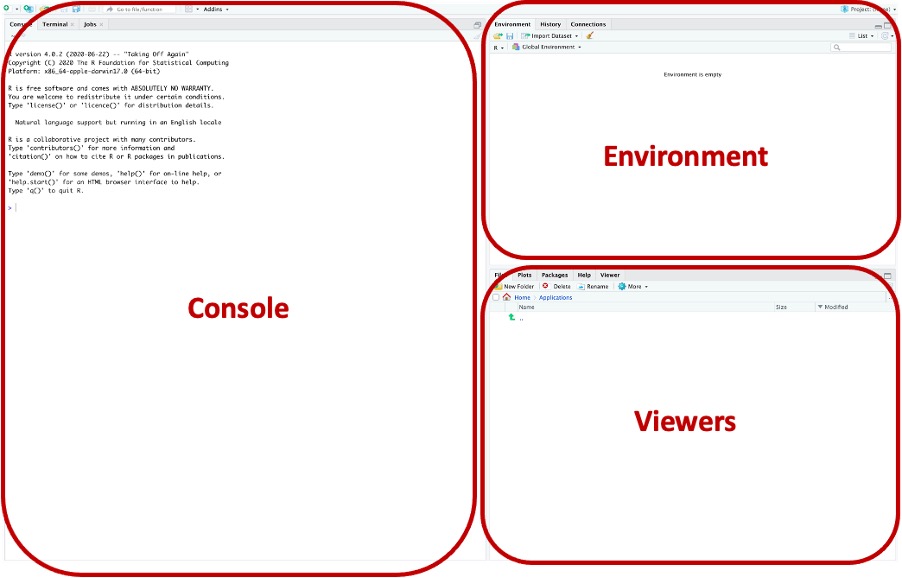
The console pane is where we will be able to see our code running (or run our code in here if we’re not using the scripts), whether there are any “errors” or “warnings” and printed outputs.
The environment is the sections where we will see the objects that we’ve imported, or created, including data frames (think of something similar to an Excel table).
In the viewers pane, there are a few tabs, including being able to navigate through the file system (‘Files’ tab), any visualisations we’ve created (‘Plots’ tab), the libraries/packages we have loaded on our machines and have available to us “locally” (‘Packages’ tab), a help section, where we can get additional details on what we need to provide the functions to work and a ‘Viewer’ tab to see HTML outputs.
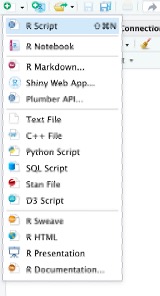
Now we’re ready to start coding
Open up an R script (there are a number of different options to code in, but a .R script is the best place to start.
To open up a script, you can either press control+shift+n on a Windows machine, or command+shift+n on a Mac, or you can select a new script with the drop down in the top-left corner:
Changing the layout as such:
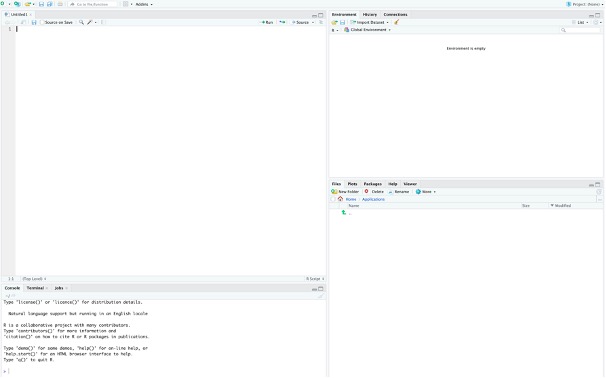
We will start writing code in the top-left quadrant.
worldfootballR
So now we’re here, ready to start coding right? Well we’ve just got one more thing to cover off. What is worldfootballR?
worldfootballR is a package made up of functions that aid in the extraction of data from popular football sites.
I know what you’re thinking - what are functions??
From DataCamp
In programming, you use functions to incorporate sets of instructions that you want to use repeatedly or that, because of their complexity, are better self-contained in a sub program and called when needed. A function is a piece of code written to carry out a specified task; it can or can not accept arguments or parameters and it can or can not return one or more values.
Crystal clear right? Well all you need to know is that worldfootballR has taken lines and lines of code to extract data and essentially condensed it down to a line (and more importantly for you, no web scraping knowledge by you).
Say for instance, you wanted to get match summary information for a particular match(es) from FBref.com… rather than learning about R programming and web scraping to be able to write this code:
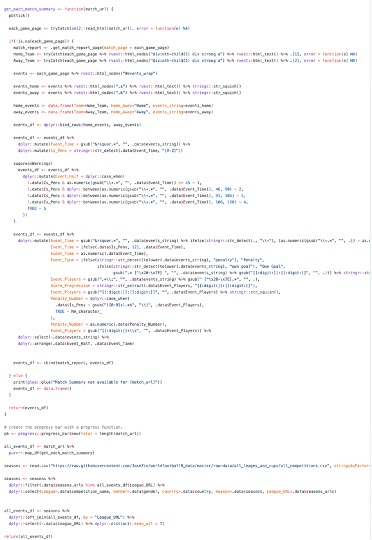
All you needed to do was run this line of code:
get_match_summary(match_url)Ok, so now I think we’re ready to start you writing code to extract and save data in a form you need.
Writing code
Before I fully get in to the nuts and bolts of the code, I just want to point you to some resources.
A website has been created for the worldfootballR package that will give you a full run down of all the functions available and the arguments you need to pass to those functions to get the data you want. The website can be found here.
Now we can really start writing code.
As we’ve already established, packages contain functions (code to do something). To use these packages they need to be installed (downloaded onto our laptops) first.
Packages will typically (but not limited to) either be housed on CRAN (a central repository for all packages) or on GitHub. worldfootballR is housed on GitHub, so the instructions for installing this package are slightly different to the packages housed on CRAN. Before we can install worldfootballR, we need to install the devtools package to enable the installation of worldfootballR. We will also install another package, xlsx that will enable us to save files in ‘.xlsx’ format.
We type (just copy and paste) these lines of code into our R script the first time we use R OR when we update our version of R OR the package updates its functionality:
# to allow us to install packages from github:
install.packages("devtools")

# a meta package that contains packages for data cleaning, analysis and visualisation
install.packages("tidyverse")

# to save xlsx files
install.packages("xlsx")
You’ll know that they have successfully installed if there are no error messages and you can see the you see the “>” symbol and a blinking cursor in the console section.
Then we will install worldfootballR (it’s what we’re all here for) and importantly load the library - it’s not enough to just install the package, we need to load it to make the functions easily available in our current session.
Note: We only need to install the package the first time we install R OR if we update our version of R, OR if there is a update to a newer version of the package.
devtools::install_github("JaseZiv/worldfootballR", ref = "main")Note 2: While we only need to install it very infrequently, we need to load the package every time we want to use the package.
library(worldfootballR)The world is your oyster
There are a number of functions in worldfootballR to enable you to get all the data you need.
To find these functions, you can visit the reference page on the package website here. The reference page will give you a brief summary of what the function does - for more detailed info, click on the function and it’ll take you to the function page.
Additionally, there are instructions and example code on the website for each of the sites data is collected from:
Let’s get some data
Now the fun part - getting data!
Before we get started, in the code below, when we see a “#” at the beginning of text, that is a comment, not executable code, and it’s how R programmers write notes to themselves, or others who use the code to give an overview of what is being done.
At the start of every script, it is best practise to include all the packages you’re going to be using/needing in your analysis. Installing packages only needs to be done the first time you start using R, when installing new versions or R, or when newer versions of the package become available and you want the updates that have been created.
The code we would run is below. A few things to remember:
- To ‘run’ code we’ve typed out, there are two main ways;
- Highlight the code you want to run and press
control+enterorcommand+enteron MacOS - Have the cursor on the line you want to run and press
control+enterorcommand+enteron MacOS
- A “#” in a script signifies comments, and I will use them in the code to tell you what we’re doing
I want shooting data!
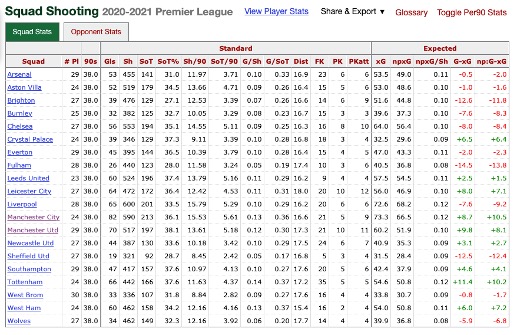
Let’s say we want to get the shooting data from FBref for teams in the 2020-2021 EPL season, to be able to analyse how many goals a team scored, or how they performed against expectation (xG), or from what average distance they shot from:
Then we run the specific code to extract shooting data from FBref.com:
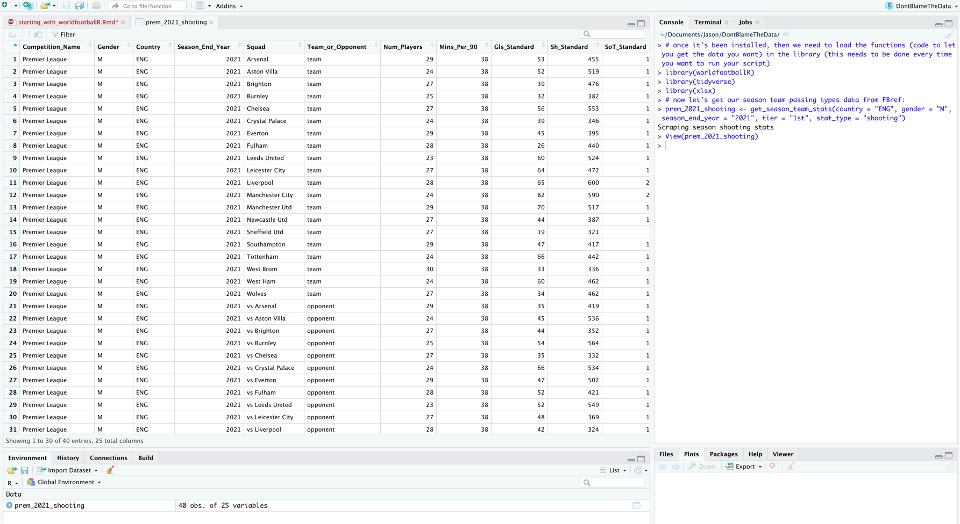
# now let's get our season team shooting data from FBref:
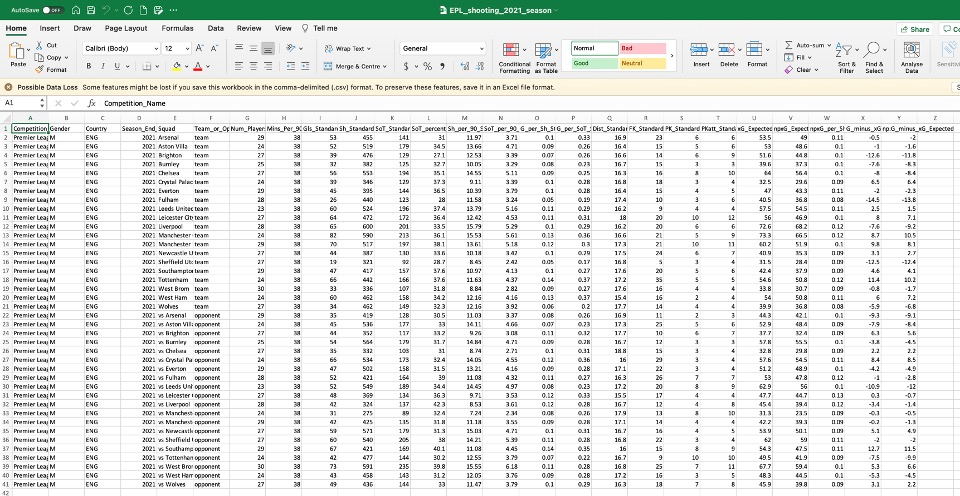
prem_2021_shooting <- get_season_team_stats(country = "ENG", gender = "M", season_end_year = "2021", tier = "1st", stat_type = "shooting")And this is what the data looks like in R now:
I just want the data and nothing else
If all you want is a csv or Excel output (to take to some other software/framework), then the below lines of code will address that need:
# to save the file as a csv:
write.csv(x= prem_2021_shooting, file = "EPL_shooting_2021_season.csv", row.names = FALSE)

# or we can save an .xlsx file:
write.xlsx(x= prem_2021_shooting, file = "EPL_shooting_2021_season.xlsx", row.names = FALSE)
And this is how our output looks, and this output can be fed in to any visualisation software we choose to use:
But R has more to offer right?
R is a whole lot more than a tool for extracting and saving data.
We can create fully customisable visualisations with code to analyse our data. This flexibility means your creative juices would only be constrained by your desire to practise and learn and practise and learn R.
Below, we have plotted a team’s performance against expected goals for the season. Teams that finished above the line scored more goals that xG would have had them scored, while teams below the dashed line scored less.
# get our data ready for plotting
prem_2021_shooting %>%
  # filter out only the team shooting data, not their opponents also
  filter(Team_or_Opponent == "team") %>%
  # create a new column that removes penalties from the team's goal total
  mutate(non_P_Gls = Gls_Standard - PK_Standard) %>%
  # start plotting:
  ggplot(aes(x= npxG_Expected, y= non_P_Gls)) +
  # add a line through the plot with slope =  1 and the yintercept = 0
  geom_abline(slope = 1, intercept = 0, colour = "red", linetype=2) +
  # we want to make it a scatter plot
  geom_point(size=6, colour="midnightblue", fill="midnightblue", alpha = 0.4, shape=21) +
  # lets also add team name labels
  ggrepel::geom_text_repel(aes(label = Squad), colour = "midnightblue", size=5) +
  # limit the x and y-axis to start at 10 and finish at 100
  scale_x_continuous(limits = c(10,100), name = "Non-Pen xG") +
  scale_y_continuous(limits = c(10,100), "Non-Pen Goals") +
  # create a title and subtitle - all plots should have this
  ggtitle("DID TEAMS SCORE AS EXPECTED?",
          subtitle = "Teams above the dashed line exceeded their xG for the\nseason, while teams below didn't") +
  # apply a pre-programmed general theme:
  theme_minimal() +
  # but then we can customise our plot even more - first we make the background black:
  # change the title and subtitle format
  theme(plot.title = element_text(size=28, face="bold"), plot.subtitle = element_text(size=22, colour="grey30"),
        # and change where the plot is aligned - in this case it's left-aligned
        plot.title.position = "plot", plot.caption.position = "plot",
        # change the size of aixs titles and text
        axis.title = element_text(size=16), axis.text = element_text(size = 14))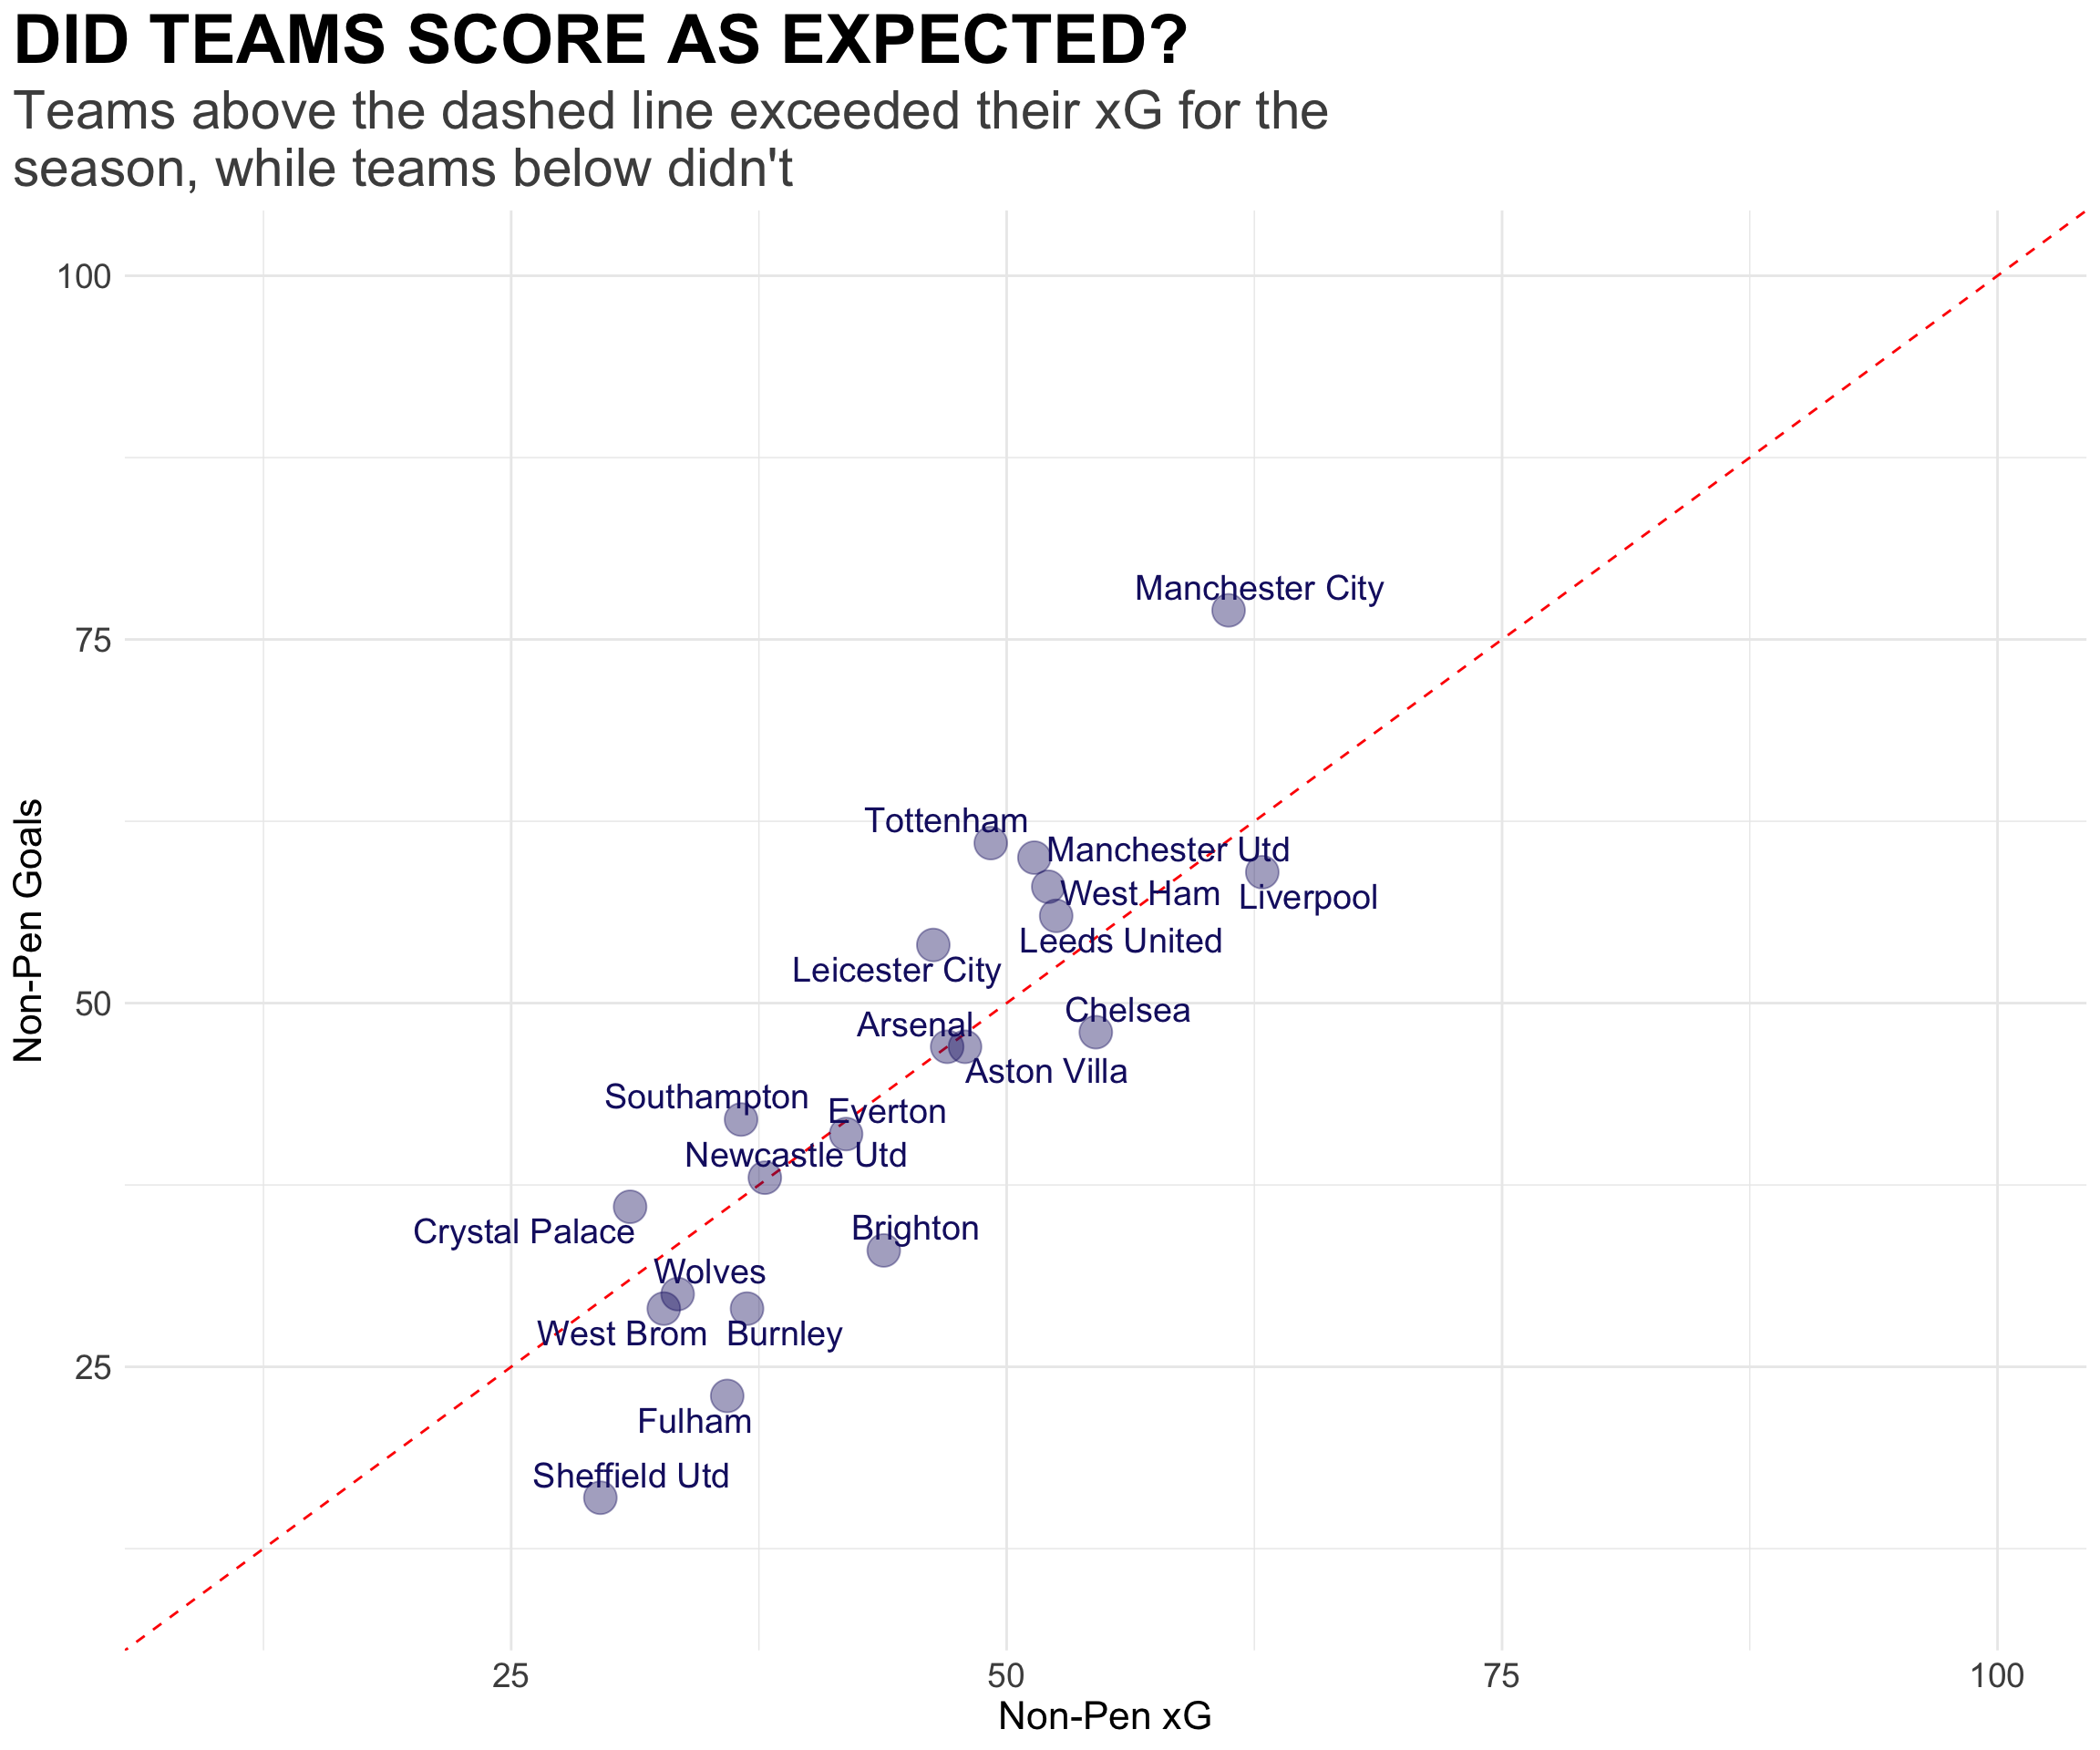
We could also calculate how closely correlated xG is to expected goals using the cor() function in R, which we see printed out to be 0.8805275 - highly correlated indicating teams score pretty close to expected:
# first we will create a new data set of only the team's performance, and not how their opponents played against them
prem_team <- prem_2021_shooting %>%
  filter(Team_or_Opponent == "team")

# now we calculate the Pearson correlation
cor(prem_team$Gls_Standard, prem_team$xG_Expected)
[1] 0.8931299More data please
FBref.com is a great site that has given analysts unprecedented access to their data, including the ability to extract to csv’s manually. This is great when there is only one extract you need, but when there are multiple extracts, then this becomes infinitely more time consuming! Functions have been created for these, and the official worldfootballR site will get you going with them.
Others, like Transfermarkt.com and Understat.com don’t give you the ability to export to files. worldfootballR is here to help there too!
# let's get the transfer balances for the 2020/21 Bundesliga season
team_balances <- tm_team_transfer_balances(country_name = "Germany", start_year = 2020)
# to save the file as a csv:
write.csv(x= team_balances, file = "bundesliga_transfer_balances2020_2021.csv", row.names = FALSE)
# or we can save an .xlsx file:
write.xlsx(x= team_balances, file = "bundesliga_transfer_balances2020_2021.xlsx", row.names = FALSE)# let's start creating our plot:
team_balances %>%
# the new two lines use 'mutate()' from the dplyr package to create or change new columns
# here, we create a net_transfer_income column that subtracts the expenditure form income
mutate(net_transfer_income = income_euros - expenditure_euros) %>%
# and we can also come up with a flag for if the income is above or below 0
mutate(green = net_transfer_income > 0) %>%
# ggplot is how we visualise our data
ggplot(aes(x=net_transfer_income, y= squad, fill = green)) +
geom_col() +
# manually select colours to use:
scale_fill_manual(values = c("darkred", "darkgreen"), name = "Made\nMoney?") +
# change the data labels on the x-axis to be formatted to currency:
scale_x_continuous(labels = scales::dollar, name = "Net Transfer Income") +
# add a caption that sources the data:
labs(caption = "Source: transfermarkt.com") +
# we also want a title and subtitle:
ggtitle("BUNDESLIGA SPENDING IN THE 2020/21 SEASON",
subtitle = "Bayern Munich and Borussia Dortmund are big net spenders this season,\nwhile Bayer 04 Leverkusen have made the most money on the transfer market") +
# apply a pre-programmed general theme:
theme_minimal() +
# but then we can customise our plot even more - first we make the background black:
theme(plot.background = element_rect(fill = "black"),
# play around with the x and y gridlines:
panel.grid.major.x = element_line(colour = "grey20", linetype = 2), panel.grid.minor.x = element_blank(), panel.grid.major.y = element_blank(),
# change the title and subtitle format
plot.title = element_text(size=28, colour = "white", face="bold"), plot.subtitle = element_text(size=22, colour = "white"),
# and change where the plot is aligned - in this case it's left-aligned
plot.title.position = "plot", plot.caption.position = "plot",
# change the colour and size of aixs titles and text, remove the y-axis title
axis.title.x = element_text(colour = "white", size=16), axis.title.y = element_blank(), axis.text = element_text(colour = "white", size = 14),
# remove the legend
legend.position = "none",
#format the plot caption:
plot.caption = element_text(size = 12, colour = "white"))![]()
Conclusion
Hopefully you’ve made it this far!
We’ve gone through an overview of the worldfootballR package, designed to help you extract football data from popular soccer data websites, we’ve installed R and RStudio, we’ve started pulling data using the worldfootballR, we’ve saved it in either .xlsx or .csv, we’ve seen some brief statistical analysis, AND we’ve also created some visualisations using a mixture of dplyr (to get our data ready) and ggplot.
Hopefully this has stoked your interests enough into the possibilities available to you using R and worldfootballR!
If you have any questions or feedback, feel free to comment, or get in touch on twitter jaseziv.
Resources
worldfootballR- FBref
- Understat
- Transfermarkt
- tidyverse - a collection of very valuable R packages for manipulating, analysing and visualising data